Instagram Engagement Rate: How to Calculate and Improve It
Three formulas give three different answers for the same post — and the interactions you feed them are not worth the same either. How to calculate the rate consistently, and which signals carry the weight.
Engagement rate is the most cited metric on Instagram, the least standardised, and — the part almost nobody mentions — not a metric Instagram publishes. Run one post through the three common formulas and you get three answers, sometimes several times apart; the tools that report them rarely say which one they used, and published benchmarks almost never state their method.
Which means most engagement-rate comparisons are comparing different quantities. Worse, they are usually comparing different ingredients: a like and a share both go into the numerator as 1, and they are not worth the same to anybody — not to a recommendation system and not to a person reading your account. This page covers how to calculate the rate consistently, which interactions carry the weight, and what actually changes the number.
The Instagram engagement rate formula
Engagement rate is interactions divided by the size of the audience that saw the post, expressed as a percentage:
Engagement rate = (interactions ÷ accounts reached) × 100
A post with 240 interactions that reached 4,000 accounts has an engagement rate of 6%. The arithmetic is trivial; the argument is entirely about what goes in the denominator, because the same post can be reported at 6%, 3% or 1.5% depending on which number you divide by. That is what the next section is about.
Meta does not define this metric
Worth settling before comparing formulas, because most articles present one as though Instagram handed it down. It did not. Meta’s Instagram insights reference lists what the platform will report for an account — reach, views, likes, comments, shares, saves, total interactions, accounts engaged — and an engagement rate is not among them, in any version of the API (Meta for Developers). There is no official formula and no official denominator, which means no engagement-rate figure can be called correct by appeal to the platform. The formula below is convention: useful, widely used, and nobody’s standard.
What Meta does define is the inputs, and those definitions are what the whole argument turns on. Reach, as Meta defines it, is the number of unique accounts to have seen the content at least once, ads included — so it cannot exceed the number of people, and it takes in anyone who saw a post because you paid for them to. Views tallies each play or display of the content, repeats and all. (Reach has a page of its own: how Instagram reach is counted.) One counts people, the other counts displays. Divide the same interactions by each and you get two numbers with no relationship to one another.
One retirement is worth knowing about as well, because it quietly invalidates a lot of published methodology. The impressions metric was deprecated for version 22.0 of the API and, for all versions, on 21 April 2025; views replaced it. Tools still report impression-style totals and some still use the word, but an engagement rate “by impressions” now rests on a number Meta no longer returns under that name.
The three formulas
By followers (ER by followers)
(interactions ÷ followers) × 100
The most quoted, because followers is the only number available from outside an account. It is what every third-party audit tool uses when it has no access to insights.
What it actually measures is interactions relative to audience size, which is a question about the audience rather than about the post. It is the right formula for auditing whether an account’s following is real, because inflation breaks it directly. It is the wrong formula for judging content, because it penalises you for followers who never saw the post.
By reach (ER by reach)
(interactions ÷ accounts reached) × 100
Requires insights access, and it depends on understanding what reach actually counts. Measures how many of the people who actually saw the post responded — which is the question you want answered when judging content.
This is the most useful formula for your own work and produces much higher numbers than the follower version, because reach is usually well below follower count. Do not compare an ER-by-reach figure against a published benchmark unless that benchmark used the same formula, which it usually did not.
By impressions
(interactions ÷ impressions) × 100
Total displays including repeats, so this always yields the lowest number of the three. Rarely the most useful, occasionally what a tool means without saying so — and, since the retirement noted above, most likely computed from a views figure with an older label on it. If a tool still says impressions, ask it what it is dividing by.
What counts as an interaction
The second source of incompatibility. Different tools include different things:
| Interaction | Usually counted? |
|---|---|
| Likes | Always |
| Comments | Always |
| Saves | Sometimes — and they are among the strongest signals |
| Shares | Sometimes |
| Profile visits from the post | Rarely |
| Follows from the post | Rarely |
Saves and shares being optional is the significant problem, because it means two tools can disagree about the same post by half while both add up correctly. A formula that drops them is measuring a different quantity from one that keeps them. Which raises the question the table cannot answer — whether the things it lists are worth the same — and they are not.
Which interactions carry the weight
The useful principle is short enough to keep: the more an action costs the viewer, the more it tells the system. A like costs a thumb movement. A share costs reputation — you are putting your name on something in front of people who know you. Systems that have to guess whether content is good weigh the two accordingly, and that single idea predicts most of the ordering below.
Be exact about the status of that ordering, because the industry rarely is. No platform has published a weight for any interaction. Instagram comes closest to a list. Its Feed explainer names five interactions it pays most attention to — dwelling on a post for a few seconds, commenting, liking, sharing, and tapping on the profile photo (Instagram Ranking Explained) — and puts them in a single flat sentence. A like and a share appear there as peers; from Instagram’s documentation alone you would have no grounds to rank one above the other.
The one place a platform has committed to a comparison in writing is TikTok. Its explanation of how For You recommendations work says a strong signal of interest — finishing a longer video, start to end, is the example it gives — counts for more than a weak one (TikTok Newsroom); the social media growth hub quotes the passage in full. No number, but an ordering — and it is the ordering the cost principle predicts. Everything in the table below is inference built on those two documents plus what the actions cost. Read it as a working model, not as a leak.
| Signal | What it costs the viewer | Inferred weight |
|---|---|---|
| Share to a specific person | Reputation, plus a judgement about one person | Highest |
| Share to a story or feed | Reputation | Very high |
| Save | An admission of future intent | Very high |
| Watch time and completion | Actual time | Very high on video |
| Comment | Effort, plus public exposure | High |
| Profile visit | Curiosity beyond the post | Moderate |
| Like | Almost nothing | Low |
| View | Nothing — on YouTube, not even a second of playback | Lowest |
Saves are the interesting row
A save is a claim that the content will have value later. On a platform optimising for time spent, that is close to a direct prediction of the thing being optimised for, and it is unusually honest, because nobody saves something to be polite.
Saves are also the row you can most reliably move, which is what makes any of this actionable. Likes are largely a function of whether people enjoyed something, and enjoyment is hard to engineer. Saves are a function of whether the content will be needed again — a format decision rather than a talent one. Reference material, comparisons, specifications, instructions somebody will follow later rather than now, lists of tools or sources, anything with a number in it that people will want to check back on.
The corresponding trap: content saved but not watched. On video surfaces a save attached to a two-second view is a weak overall signal, because completion is weighted heavily and you failed it.
Watch time behaves as two separate things
Completion rate is the proportion who reached the end, and short content has a structural advantage at it. That, rather than any virtue in brevity, explains why the shortest clips tend to do disproportionately well: finishing them is easy.
Rewatches are watch time exceeding the length of the video, and they are the least ambiguous signal available. A viewer who watched something twice was not being polite.
Both make the first two seconds the whole game. A viewer who scrolls past at 0.4 seconds registers as a failure on the metric that matters most, and nothing later in the video can compensate for a signal that was never generated.
Comments are worth less than they look
Comments cost effort and are weighted well, but the weighting appears to read quality rather than count — length, whether comments reply to each other, whether the author answered. Which is why comment pods and “comment below!” tactics under-deliver: fifty comments saying “🔥” are cheap to produce and read as cheap, while a genuine exchange under a post is a different signal entirely.
If you want comments, ask something with a cheap answer that people have an opinion about. “Which of these two?” outperforms “what do you think?” by a wide margin, because the second requires composing something.
Likes and views sit at the bottom for the same reason
Likes are the most visible interaction and the least informative. They cost nothing, they are given reflexively, and they are the cheapest thing to purchase — three descriptions of one fact. They still count for something; they are simply the weakest of the countable signals, and the attention they get is a legacy of their having once been the only public number.
Below the like sits the view, which on YouTube now costs the viewer nothing at all. From 24 August 2026, YouTube’s help pages count a view as soon as playback begins, in every format, Shorts and live streams included (YouTube Help). The document sets no minimum duration; the platform re-validates views afterwards. YouTube views explained covers the counting rules and what they mean for anyone buying them. The pattern is worth noting in general, though — the cheaper a signal is to produce, the more work a platform has to do downstream to decide whether it meant anything.
Why this is the reason bought engagement does so little
Line the hierarchy up against a panel catalogue and the two match almost exactly. What is cheap to buy — likes, views, follows — is precisely what is weakly weighted. What is heavily weighted — completion, rewatches, saves, shares to real people, substantive comments — is either impossible to fake or expensive enough that nobody sells it at scale.
That is not a coincidence, and if you keep one idea from this page, keep this one. Signals are weighted by how hard they are to produce insincerely, because that is what makes them informative; a system that weighted likes heavily would be trivially gamed, so it does not. The consequence for a buyer is that the purchase moves numbers on a screen while the inputs that decide distribution stay flat — and the denominator of every ratio on this page grows. What an SMM panel actually sells covers what is on offer at the other end of that trade.
Why benchmarks are mostly useless
An article stating that “the average Instagram engagement rate is X%” is uninterpretable unless it also states the formula, which interactions were counted, the account size band, the content format, and the sample. Most state none of these.
Beyond the methodology problem, there are real reasons the number varies enormously between accounts:
- Size. Engagement rates fall as accounts grow, reliably. A small account’s rate is not comparable to a large one’s.
- Format. Reels, carousels and single images produce different interaction patterns.
- Subject. Some topics generate saves; some generate comments; some generate silent viewing.
- Audience composition. An account with dormant followers has a lower rate for reasons unrelated to its content.
The useful comparison is always against yourself. Your rate this month against last month, calculated the same way, tells you something real.
It is also worth being clear that the rate is a diagnostic rather than a goal. An account whose audience is a small but genuinely valuable niche can post a poor rate alongside excellent commercial results, and chasing the percentage there means optimising for a number that is not the one paying you. The two jobs the rate does reliably are narrower: detecting change in your own account, and detecting inflation in someone else’s — the second of which is covered in the follower audit.
Tracking it properly
- Pick one formula and write it down. ER by reach for judging content; ER by followers for auditing an audience.
- Define which interactions you count and include saves and shares.
- Measure at a fixed post age. Seven days is reasonable. Comparing a fresh post to a month-old one measures age.
- Average across at least ten posts. Individual posts vary too much to read.
- Segment by format. Averaging Reels with carousels hides where the difference is.
- Track saves and shares separately, as rates against reach. They are the rows most worth watching and the ones a blended rate hides. A raw count moves with distribution and tells you nothing about the content.
What actually improves it
Since the rate is interactions over audience, there are only two directions: more interactions, or a better-matched audience. Given the hierarchy above, they are not equally available — the first is a set of small deliberate changes, the second is slow and structural.
More interactions
In the order the weighting implies: fix the first two seconds, since no later signal exists for a viewer who has already scrolled on; then completion, on any video surface, which mostly means cutting whatever is not needed; then saves, which means naming the action and giving it a reason — “save this for later” outperforms “let me know what you think” because it asks for something specific; then comments, via questions with cheap answers; and last, likes, which will happen on their own and are not worth building around.
Shares sit awkwardly in that list because they are the hardest to engineer deliberately. Content gets shared when sharing it makes the sharer look good, which is a property of the idea rather than of the format.
A better-matched audience
This is the larger and slower lever, and it is where most low rates actually originate.
- Keep the subject coherent. An audience assembled around one thing does not engage with another.
- Do not chase reach that does not fit. A viral post outside your subject brings followers who joined for that one thing and ignore everything else, so the denominator swells and your rate falls for months afterwards — usually recovering as those followers drift away.
- Do not add followers who cannot engage. Purchased followers change the denominator only, which is the fastest way to halve the number. Meta’s spam standard rules them out anyway — selling, buying or exchanging anything for engagement is prohibited there, with likes, views and follows among the examples it names (Meta Transparency Center) — but the arithmetic is what you feel first. The Instagram followers guide covers it.
A worked example
To make the incompatibility concrete. One post, one account, three formulas. The figures are illustrative arithmetic, not a measurement.
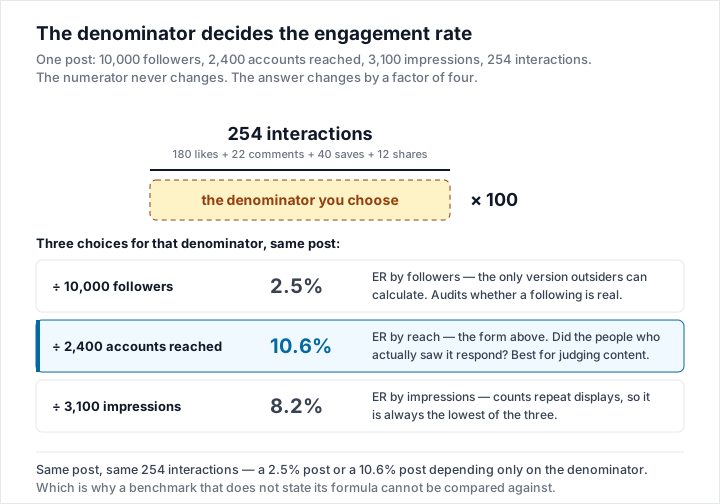
An account with 10,000 followers publishes a post. It reaches 2,400 accounts, generates 3,100 impressions, and receives 180 likes, 22 comments, 40 saves and 12 shares.
| Formula | Calculation | Result |
|---|---|---|
| By followers, likes + comments only | 202 ÷ 10,000 | 2.0% |
| By followers, all interactions | 254 ÷ 10,000 | 2.5% |
| By reach, all interactions | 254 ÷ 2,400 | 10.6% |
| By impressions, all interactions | 254 ÷ 3,100 | 8.2% |
The same post is a 2.0% post or a 10.6% post depending on nothing but the method. Both figures are correct. Neither can be compared against the other, and neither can be compared against a benchmark that did not state which it used.
Notice also what the first row drops: the 40 saves and 12 shares, which by the hierarchy above are the most informative interactions the post produced. The most commonly quoted formula is the one that discards the best evidence.
This is why the only useful discipline is picking one and never changing it. A consistent 2.0% that moves to 2.4% next month is information. A 2.0% compared against an article’s “average of 4.7%” is not.
What to do when the number moves
A change in the rate has three possible causes and they need separating before you act.
The numerator moved. Interactions changed — your content performed differently. This is the case you want, because it is the one you control directly. Check which rows moved: a rate that rose on likes alone is a different event from one that rose on saves.
The denominator moved. Followers or reach changed while interactions held. If followers grew, the rate falls without anything getting worse. If reach fell, the rate rises while your situation deteriorates — a smaller, more committed group is seeing you.
That second case is the trap. A rising engagement rate alongside falling reach is a bad sign wearing a good disguise, and it is common on accounts that have started to lose distribution. Always read the rate next to the absolute reach figure. What makes a follower count fall covers the patterns.
The mix moved. You changed format — more Reels, fewer carousels — and formats have different baseline rates. Segmenting by format prevents this from looking like a content problem.
The rate matters because of what recommendation systems do with the interactions behind it. How that works platform by platform is laid out in the social media growth hub; what a tap through to your profile leads to is the subject of how profile visits turn reach into followers.
Keep reading
Social Media Growth
What 15 Public SMM Panel Catalogues Listed, Read Three Times in a Month
Fifteen public SMM panel catalogues, each read inside a window of seconds on 2 September, 13 September and 2 October 2026 — what…
32 min read
Social Media Growth
76 SMM Panels, One Piece of Software
We read the public pages of 84 SMM panels in one thirteen-minute window. Of the 76 that answered, 54 run the same vendor's…
8 min read
Social Media Growth
What Is an SMM Panel and How Does It Work?
Panels are reseller storefronts sitting on top of a much smaller number of suppliers. That structure explains almost everything…
17 min read
Social Media Growth
SMM Panel Buyer’s Guide: How to Choose One Safely
What to check before paying, which reassurances are worthless, how staged delivery gives you a point to stop a bad order, and…
17 min read